BIRMINGHAM — Alabama’s population became more diverse over the past decade as the number of non-Hispanic Whites declined and more Alabamians identified as being of a different race, a mixture of races, or of Hispanic descent, according to the 2020 Census.
The 2020 Census marked the first decennial census in history that either Alabama or the U.S. recorded a decline in the White population. The Public Affairs Research Council of Alabama recently released a report on the issue.
 The PARCA report is available here.
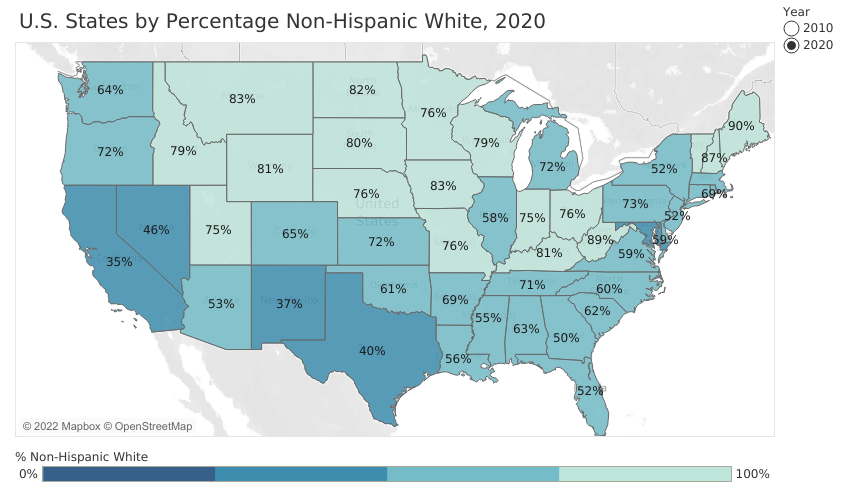
In 2010, 67% of Alabama’s population identified as non-Hispanic White. By 2020, that percentage was down to 63%. That’s according to 2020 Census data released earlier this year.
Demographers expected a decline due to falling birth rates and the aging of the population, including the unusually large and predominantly White Baby Boom population. Black, Hispanic, Asian, and American Indian populations all increased.
Madison County’s non-Hispanic White population increased by 16,000 and its Black population grew by 16,052; non-Hispanic More than One Race population grew by 13,027; and its Hispanic population increased by 9,532. Despite the growth in the non-Hispanic White population, the county’s population percentage decreased from 66% of the population in 2010 to 61% in 2020.
Meanwhile, in Huntsville, each of the four largest groups grew: Hispanics (+6,157) and non-Hispanic Whites (+14,100), Blacks (+6,745), and non-Hispanic More than One Race (+6,184). The non-Hispanic White population decreased in its share of the population from 58% to 55%. The Black population share decreased from 31% to 29%, but the Hispanic share increased from 6% to 8%. Individuals of More than One Race increased to 4.6% of the population, while the Asian share of the population increased slightly to 2.5%.
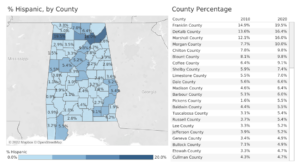 In Alabama, the counties with the highest percentage of Hispanic residents are in North Alabama, in a band stretching from Franklin County in the west to DeKalb County in the east. Those counties where the Hispanic population is most concentrated are also centers for the poultry industry, which was an initial draw for Hispanics settling in Alabama.
Secondary concentrations are evident in Tuscaloosa and Pickens counties and in southeast Alabama’s Wiregrass region, the report said. Those are also coincidental with poultry industry concentrations. Higher percentages of Hispanics can also be found in Shelby, Madison, Baldwin, Lee, and Limestone counties, where residential and commercial construction jobs are plentiful.
But in terms of numbers, the most Hispanic and Latino residents are found in Alabama’s more populated metro counties. Jefferson County’s Hispanic population is now nearly 35,000, while neighboring Shelby is home to over 16,000. Madison County is second in the state with almost 25,000 Hispanic and Latino residents, complemented by strong Hispanic populations in neighboring Marshall (15,658) and Morgan (12,377) counties. Madison County added more Hispanic residents than any other Alabama county over the previous decade.
But the biggest change was in the number of people identifying as More than One Race, indicating an erosion in traditional ethnic and racial distinctions.
The Census Bureau cautions that some portion of the decline in the “Non-Hispanic White alone” population is likely due to changes in how people responded to new wording on the race question.
The Census Bureau changed the wording and presentation of the race question on the 2020 Census. In 2020, for the first time, the “White” choice was followed by example countries of origin in Europe, the Middle East, and North Africa. Similarly, the Black or African American option listed African and Caribbean nations as example origins.
All respondents were asked to elaborate on their origins in a text box below their selection. This change from 2010 appears to have led more individuals to reclassify themselves as not being “White alone” but instead as being of more than one race or origin.
Regardless, the Bureau believes the new totals present a more accurate picture of an increasingly diverse nation.
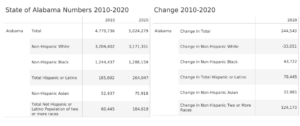
Nationally, the non-Hispanic “White alone” population decreased by 5 million or 2.6% from 2010 to 2020. In Alabama, that population declined by 33,000, from 3.20 million to 3.17 million.
Meanwhile, the number of people identifying as non-Hispanic and of more than one race far exceeded the increase in any other category, 124,173, compared to the 78,445 increase in the Hispanic population, the second fastest growing group. The number of non-Hispanic residents who reported themselves as White in combination with another race rose by 118,249, a 222% increase, from 53,260 to 171,509, from 1.2% of the population to 3.6%.
The number of respondents who reported themselves as Black in Combination with another race also rose sharply, up 130% in Alabama, the third highest growth rate in the country in that category, a numerical increase of 38,767 over 2010.
Hispanics now make up 5.3% of the Alabama population, while non-Hispanic Blacks make up 25.6%. Non-Hispanic individuals of more than one race make up 3.7% of the population, now the fourth largest demographic group.
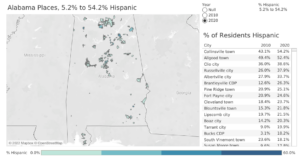 In terms of numbers of Hispanic inhabitants, the larger populations are found in the state’s big cities. Huntsville has more Hispanic residents, 16,669, than any other Alabama city, followed by Montgomery, Birmingham, and Decatur, each with over 9,000 Hispanic residents.
Near Birmingham, Hispanic communities along the Interstate 65 corridor in Hoover, Pelham, and Alabaster total over 10,000. Out of 597 Alabama cities, towns, and places, 450 saw either flat or increases in the Hispanic population. Among Alabama cities above 20,000 in population, only two, Hoover and Homewood, saw a decline in their Hispanic populations over the decade. Homewood was down by 417, Hoover by 211.
Both in Alabama and across the country, non-Hispanic whites remain by far the largest racial group representing 58% of the population nationally and 63% of the population in Alabama. Alabama’s non-Hispanic white population percentage ranks No. 30 among the states.
While the Hispanic, Asian, and multiracial populations are of interest because of their rate of change, the enduring story of Alabama is the population patterns of Black and White, a story stretching back to statehood.
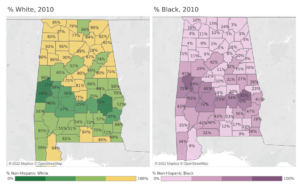 The general pattern remains in Alabama: 11 counties are majority black, the south central Alabama counties of the Black Belt, named for their rich soil, counties that historically had the highest concentration of cotton plantation agriculture and enslaved persons. Those black majorities persisted after emancipation and continue today.
Greene County has the highest percentage of non-Hispanic Black population, over 80%. The most populous majority black county is Montgomery County, with over 229,000 residents, 55% of whom are Black.
Meanwhile, Winston County, in rural northwest Alabama, has the highest percentage of Non-Hispanic White residents at 92%, with Cleburne (91%), Cherokee (90%), Cullman (89%), and Marion (89%) not far behind.
In 11 counties, the Non-Hispanic White population increased. Baldwin County saw the largest increase over the decade, with a gain of 34,000, followed by Madison, Lee, and Limestone. However, those counties all diversified as well. Blacks, Hispanics, and other groups also grew in numbers.
The counties with the most significant decline in the number of residents identifying as Non-Hispanic White were Mobile (-17,201), Jefferson (-15,961), and Montgomery (-14,745). Remember that some of that “decline” in the count may be attributed to individuals reclassifying themselves. However, those population changes in the white population correspond with overall population counts and flows that show continuing movement to suburbs located in adjacent counties.